

Week of March 6th, 2023
Week of March 6th, 2023
200SMA backtest on $SPY held, possible h&s now. Plan for $SPY $TSLA $AAPL $NVDA $AMZN

On the prior email we observed the 2B bottom formation and the likely rally towards 400-403 area.
“This can indicate that potential 2B bottom move we mentioned yesterday, which can see SPY go back towards 400.67-403 area. We will need to see where we open tomorrow, and the orderflow levels will be key.” (from March 3 newsletter)
On Friday we saw exactly that happen, with SPY running into that 403-404 area. Now what?
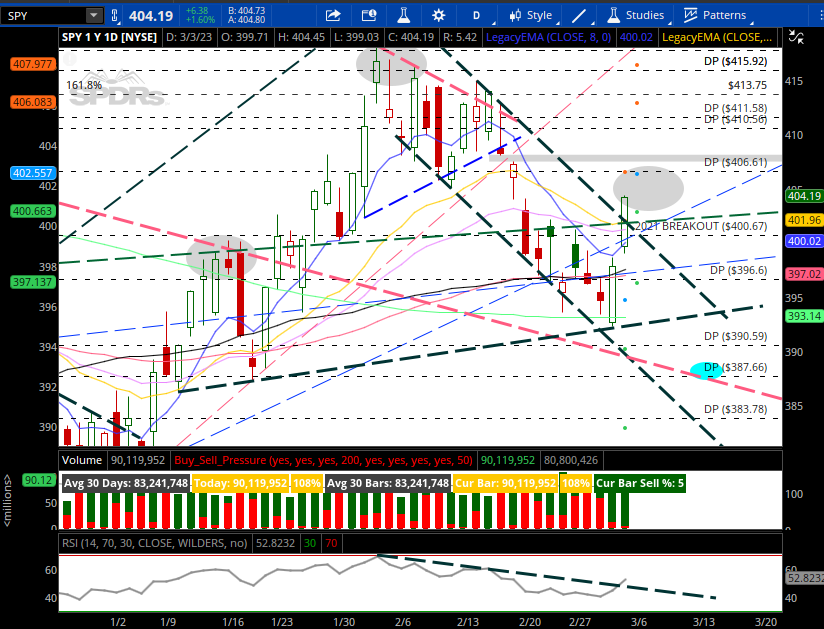
The theme so far over the past month has been that large sellers are selling slowly in the 4100-4200 area so as to maximize the amount of liquidity they are able to extract at higher prices. We confirmed this through the dark pool sells, which although there was always a subsequent red day, price would trade back up slowly, but never higher than the prior dark pool sell, before another dark pool sell transaction appeared taking us into consistent lower highs since February 2nd. There have been some small dark pool buys at 396.60 area but until buyers can overcome the prior dark pool seller areas, we can’t assume that we have bottomed for this wave.
Now, we can see a potential head & shoulders pattern that can play out here as we approach 4100 on $ES_F again, although it’s still too early to assume, but we should keep in mind that we may be forming a right shoulder now on SPY 0.00%↑ and $ES_F.
Notably, there is a bullish divergence, however this can change rapidly if we were to see a large sell day on Monday or Tuesday. So just something to keep in mind. SPY 0.00%↑ closed on Friday comfortably over the 50SMA and 200SMA and even the 8ema.
The most important thing for me next week will be to watch that prior dark pool sell area at 406.61-407.22. If the market makes 2 daily closes above that level, it’s likely that we can head towards $422.23+. However, if we reject hard at that level, then 383.78-387.66 is still on the cards for March
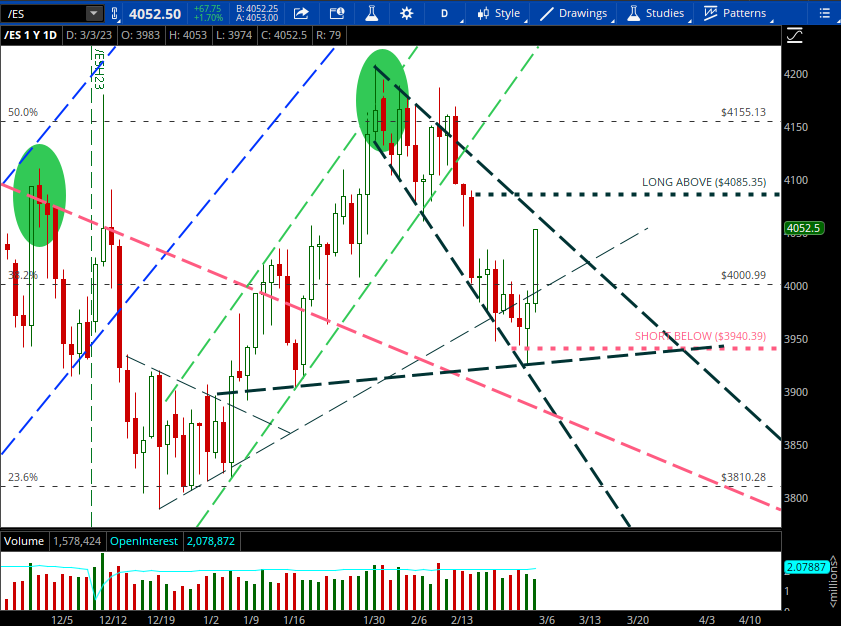
My levels on $ES_F for next week will be:
3940 and 4085
For the bullish case to 4223-4300, I will need to see a couple of daily closes over 4085.
Otherwise, it is likely that sellers will re-emerge as we approach the 4100 area for a trip back down to 3940, and deeper to 3894.
SPY 0.00%↑
406.61-407.22 major resistance level prior dark pool sell and significant order flow levels.
As long as 406.61-407.22 is not breached, I favor a sell back towards 393.14 and 390.59.
Monday intraday trading:
403.75 pivot
→ Above pivot target 406.61, 407.22
→ Below pivot target 400.67
→ Break below 400.67 target 396.60
TSLA 0.00%↑
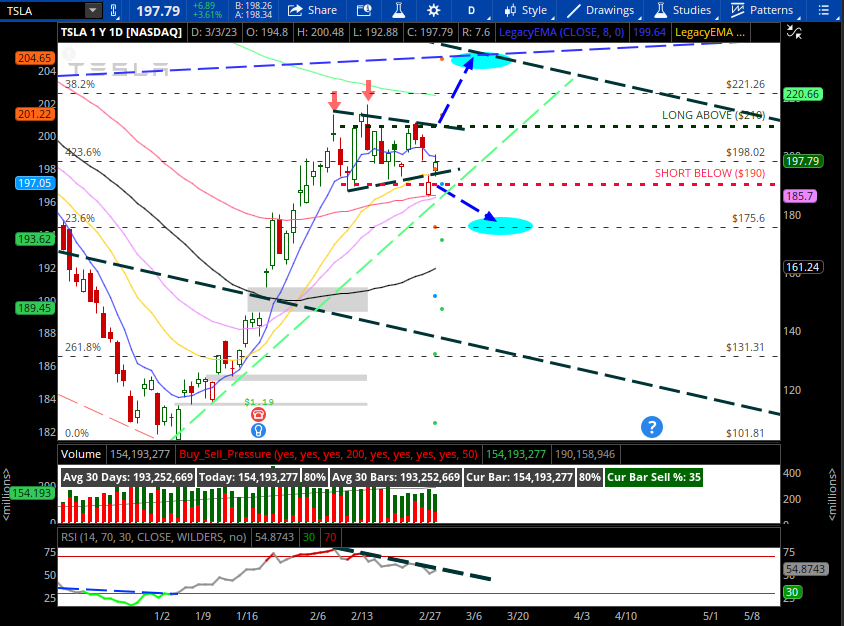
Gap has been filled, closed below major fib level 198.02
Monday / Daytrading:
198.02 pivot
→ Below Pivot target 194, 190
→ Above pivot target 204, 210
Week:
→ Below 190 target 175.60
→ Above 210 target 221.26, 235
AAPL 0.00%↑
Bigger picture is in a bull flag on daily chart, bullish divergence
146.62 key level. Above this, likely retests 153.56. Below 146.62 then 141.30 is likely.

NVDA 0.00%↑
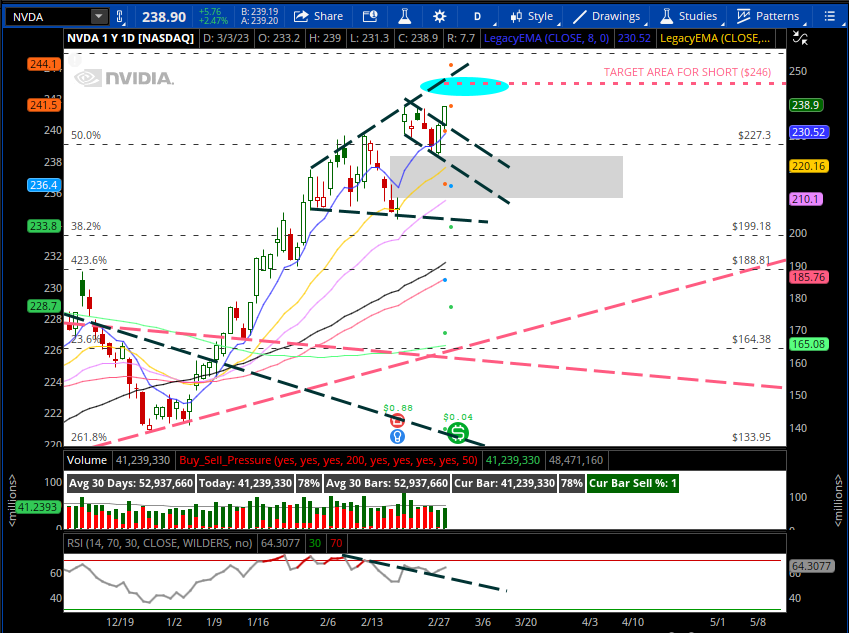
Reminding me of TSLA back at 310 before it declined sharply over 60%.
NVDA showing strength overall this past couple of weeks, left a large gap below unfilled but continues to hold above that 227.30 key level.
Watching this 238-246 area as the ideal entry for shorts, couple of months out.
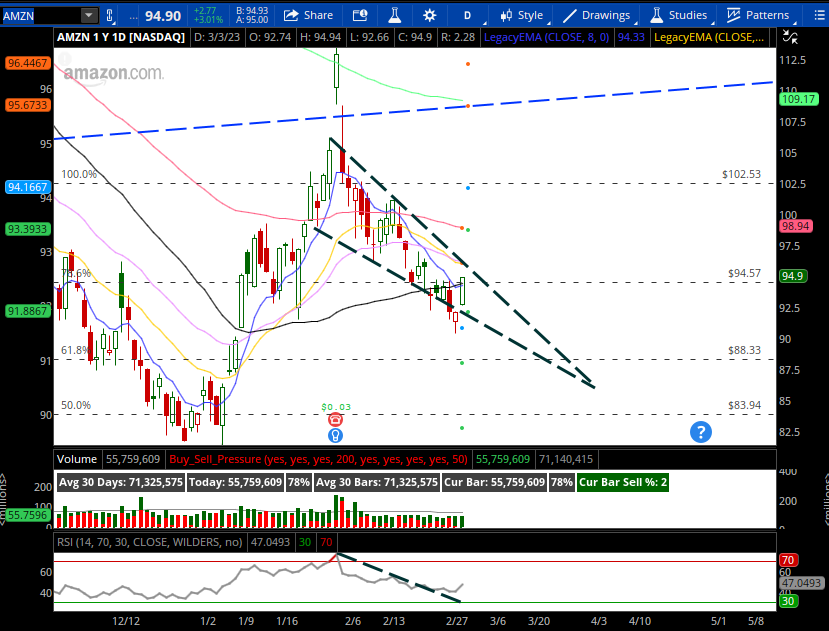
AMZN 0.00%↑
Steady call flow buying all of Friday.
Relative to rest of the other big names like TSLA 0.00%↑ AAPL 0.00%↑ NVDA 0.00%↑ META 0.00%↑ this one is lagging as it has been stuck below the 50SMA all of last week.
RSI is finally indicating a bullish divergence here and on Friday it managed to close above the 8ema (first time since 2/15), the 50sma, and above that fib at 94.57.
I think we can see continued follow through into 97-102 area as long as we can hold 94.57
Will send out real time updates in the discord.
- Jovan