

Week of March 27th, 2023
Week of March 27th, 2023
Rising wedge on $SPY continues

Two weeks ago we discovered large dark pool buys that took place on $385.90 which offered strong support for the market and SPY 0.00%↑ price has held above that level since.
Last week we pointed out that SPY 0.00%↑ was trading in a bear flag consolidation pattern, with a range of 385.90 - 393. This flag has since evolved into a rising wedge, and has had both a failed breakout (upside) and failed breakdown (downside), each time returning back into the wedge for more consolidation, awaiting resolution
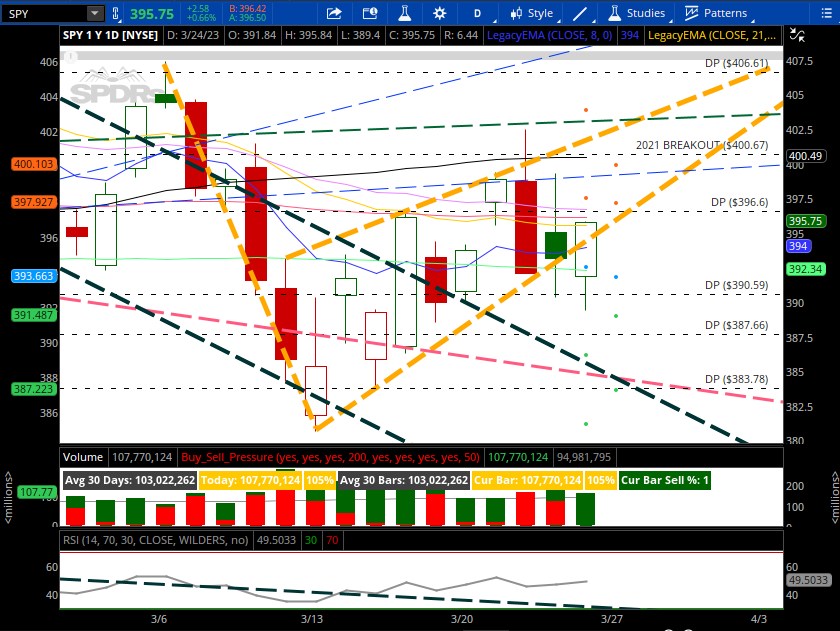
On Wednesday, bulls failed to breakout and we saw a sharp rejection off the 400.67 orderflow level and the 50SMA, with price pulling back to the 200sma. On Thursday we fell below the 200SMA but recovered it before the close. Friday we again tested the 200SMA and it held. For now we are pinned between the 50SMA which is offering resistance, and the 200SMA which is offering support.
The 50SMA is currently at 400.49 and the 200SMA is at 392.34. SPY closed at 395.75 on Friday.
For next week, we will need to see but it will be hard for bears to push any lower if we trade over 396.60 as this implies MORE consolidation within the wedge. The wedge can technically trade in a tightening range for another 1-2 weeks before resolution which may squeeze out bears and cause maximum pain before it resolves.
For next week here’s what I will be watching:
SPY 0.00%↑
Shorts only below 392.34. I think trying to short above this level may result in premium crush, unless you are sizing into a big short that is for several weeks or months out. Optimal spot for shorts (shorter term) would be 403.75-406.61 area.
389.15 and 396.60 pivots (below 392.34 you can target 389.15 but still chop zone)
Below 389.15, take shorts to target 387.66, 385.90 and 383.78.
Above 396.60, scalp long to target 400.67, 403, and overshoot 406.61. We should not trade any higher than 410.56 (daily close) - or else the bearish pattern is void
The two scenarios i’m looking at over the next week or two is this..
1. Assuming we don’t take out 390.59 level the rest of the week can be extremely choppy, looking something like this (see the dark green lines)
2. If we can manage to close below 200SMA, then it may look something like this (red lines)

Keep reading with a 7-day free trial
Subscribe to JR28 TRADING SUBSTACK to keep reading this post and get 7 days of free access to the full post archives.