

Week of April 17th, 2023

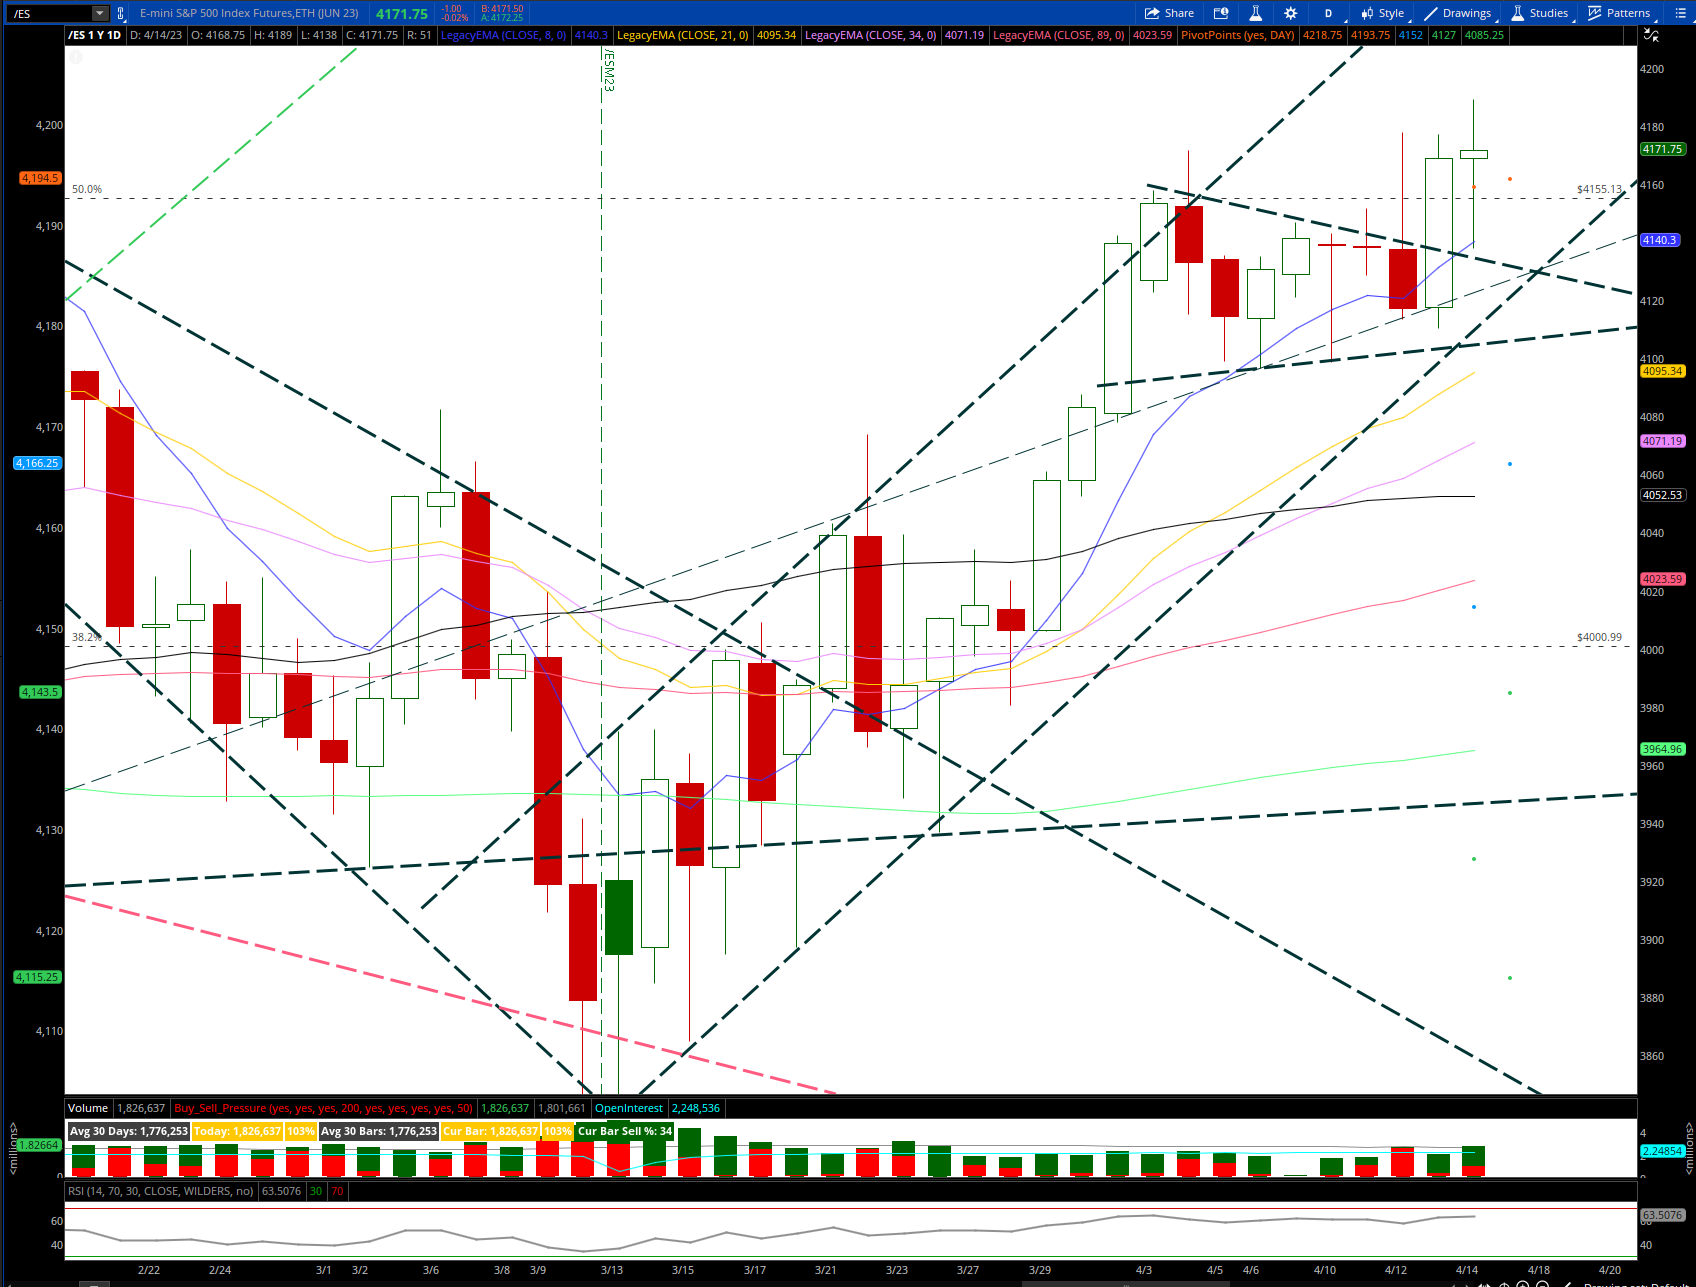
$ES_F, breakout from bull pennant, still within this bullish channel:
Back on Sunday I sent this possible trajectory for SPY 0.12%↑ :
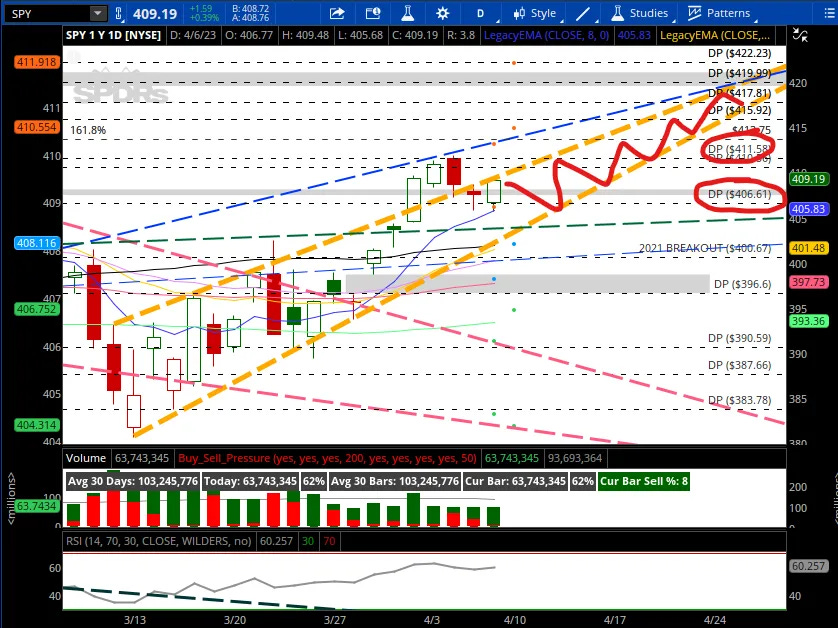
With the following message:
Possible chop for rest of month, unless we get solid closes over 411.58 early in the week, or below 406.61 as mentioned. Need to see a volatility event, or catalyst for a big breakout of range.
And here is the result after this week so far:
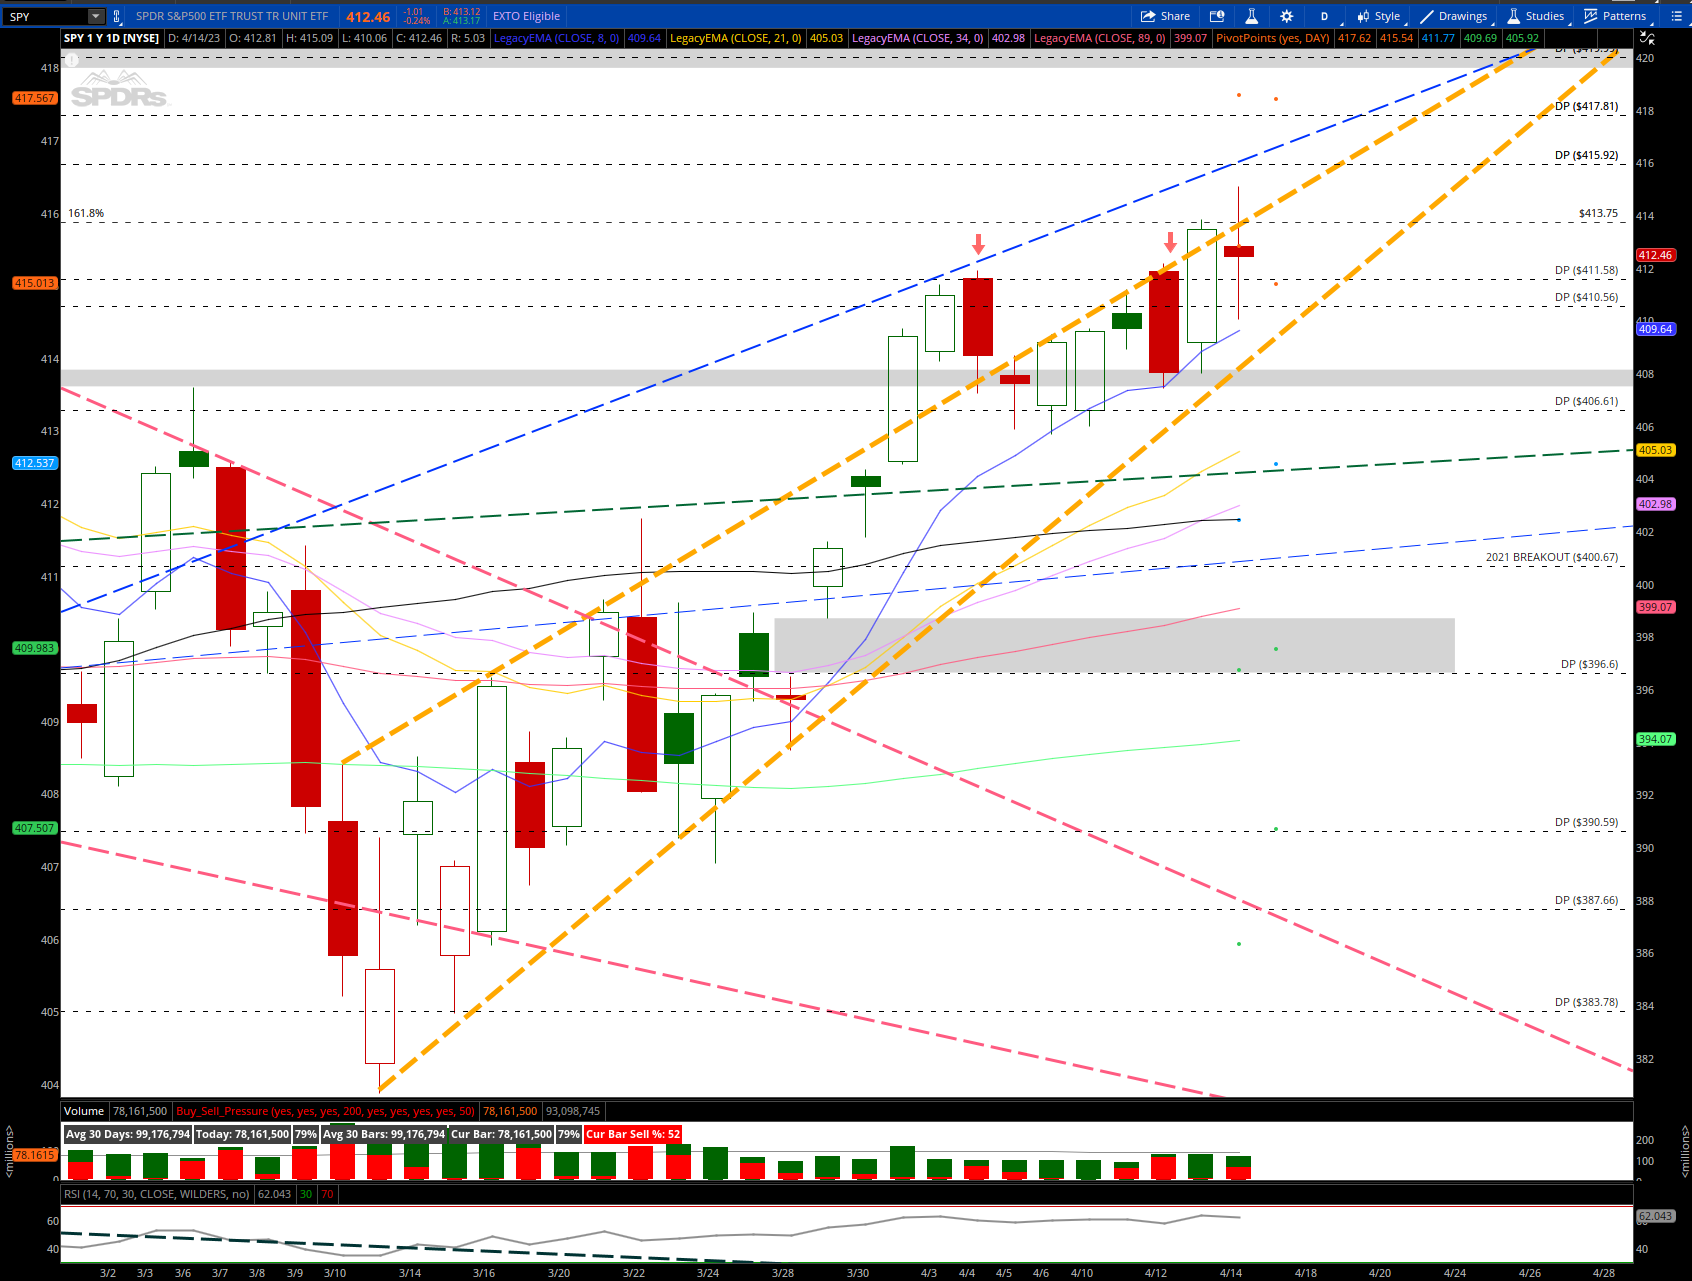
SPY continues to chop up in this rising wedge all month awaiting a catalyst that will lead it towards its next large directional move.

SPY 0.00%↑ weekly chart shows that it traded in a downtrend from Jan 22 thru Jan 23 where it broke out of the downtrend, then retested it and then it held and continued to rally. While it is still too soon to predict what pattern will be next to form, it's important to at least be aware that we are currently near the highs from February, but still lower highs. Essentially while we did put in a higher low, we have not yet put in a higher high, and this could turn into a head & shoulders or a 2B top quite easily. The overall macros, the continuous extreme bearish flow and overall market conditions need to be considered in the mix and not just a chart. A chart can easily be manipulated and as a trader you need to remain vigilant.
During the week we noticed substantial dark pool activity come in at 409.22 and that level was defended and supported the markets for the entire week. Reminder there are unfilled gaps at 396.49 and 421.11. The 8ema has supported the markets since 3/9. Would need to see 2 consecutive closes below the 8ema for a change in trend.
Here are the levels and setups we will be watching for the week ahead:
Keep reading with a 7-day free trial
Subscribe to JR28 TRADING SUBSTACK to keep reading this post and get 7 days of free access to the full post archives.